Originally posted on IdahoEdNews.org.
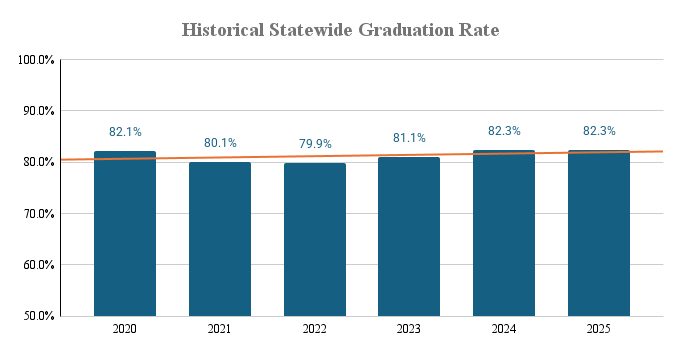
BOISE, ID – Idaho’s 2025 graduation rate stayed the same as the year prior, at 82.3%.
The stagnation comes after a 10-year high in 2024 and breaking the state’s goal of 81.6%.
Of the 26,484 students who started ninth-grade in Idaho schools, 21,809 graduated on time in 2025 — 4,675 did not.
Historically, Idaho’s graduation rates have fallen far below the national average. The most recent data from the National Center for Education Statistics shows a national average of 87% for the 2021-22 school year with Idaho’s rate at 79.9% that same year.
See your charter or district graduation rate below.
How are graduation rates calculated?
Idaho uses the adjusted cohort graduation rate method, the national standard, which tracks the percentage of first-time ninth graders who earn a regular diploma within four years. That rate is adjusted for students who transfer in and out of a school, though schools can’t always track where a student goes. A student may move out of state or start homeschooling and not notify the district, so they count as a cohort non-graduate. Special education students who stay enrolled past the four-year mark also count against a school’s graduation rate. Students who qualify can stay enrolled in school until age 21. Idaho also tracks a 5-year graduation rate.Statewide, 15 high schools had a 100% graduation rate. Those schools are typically small. The smallest was Clark County High with five students. Meridian Medical Arts Charter was the largest, with all of its 42 seniors graduating.
Schools with perfect rates:
School
Cohort size
Meridian Medical Arts Charter
42
Council
12
North Gem
10
Oakley
25
Clark County
5
Salmon River
8
Nez Perce
11
Dietrich
19
Rockland
16
Castleford
19
Murtaugh
36
Cambridge
10
Richard McKenna Charter (on-site)
18
American Heritage Charter
14
Gem Prep: Meridian
19
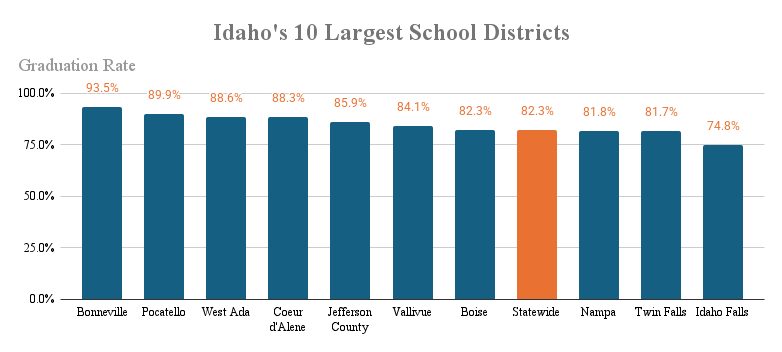
The state’s largest school districts had a wide variance in graduation rates, from 93% in Bonneville to 74.8% in Idaho Falls. Seven large districts outperformed the state average while three were below the benchmark, the same mix as last year.
Vulnerable student groups from across Idaho continue to be less likely to graduate on time.
| Group | Grad rate | Cohort size | State goal |
| Economically disadvantaged students | 74.4% | 11,534 | 72.6% |
| English learners | 66.3% | 1,488 | 68.6% |
| Students with disabilities | 60.7% | 3,067 | 60.2% |
| Students in foster care | 42.8% | 138 | N/A |
| Homeless students | 58% | 1,360 | N/A |
| Students from migrant families | 74.1% | 510 | N/A |
| Students from military families | 88.7% | 434 | N/A |
Differences in graduation rates continue amongst racial groups.
| Group | Grad rate | Cohort size | State goal |
| Asian | 86.5% | 318 | 88% |
| Black/African American | 72.1% | 351 | 72% |
| Hispanic or Latino | 76.8% | 5,344 | 75.8% |
| Native American or Alaskan Native | 71.4% | 245 | 763% |
| Native Hawaiian or Pacific Islander | 74% | 96 | 74.2% |
| White | 84.4% | 19,235 | 84.5% |
| Multiracial | 78.4% | 895 | 79.2% |
| All students | 82.3% | 26,484 | 82.5% |
Idaho Education News data analyst Randy Schrader contributed to this report.